This is a 48 year old male with many years of hearing loss in the right ear. He has a known diagnosis of an acoustic neuroma (aka. vestibular schwanoma). He was diagnosed 8 years prior.

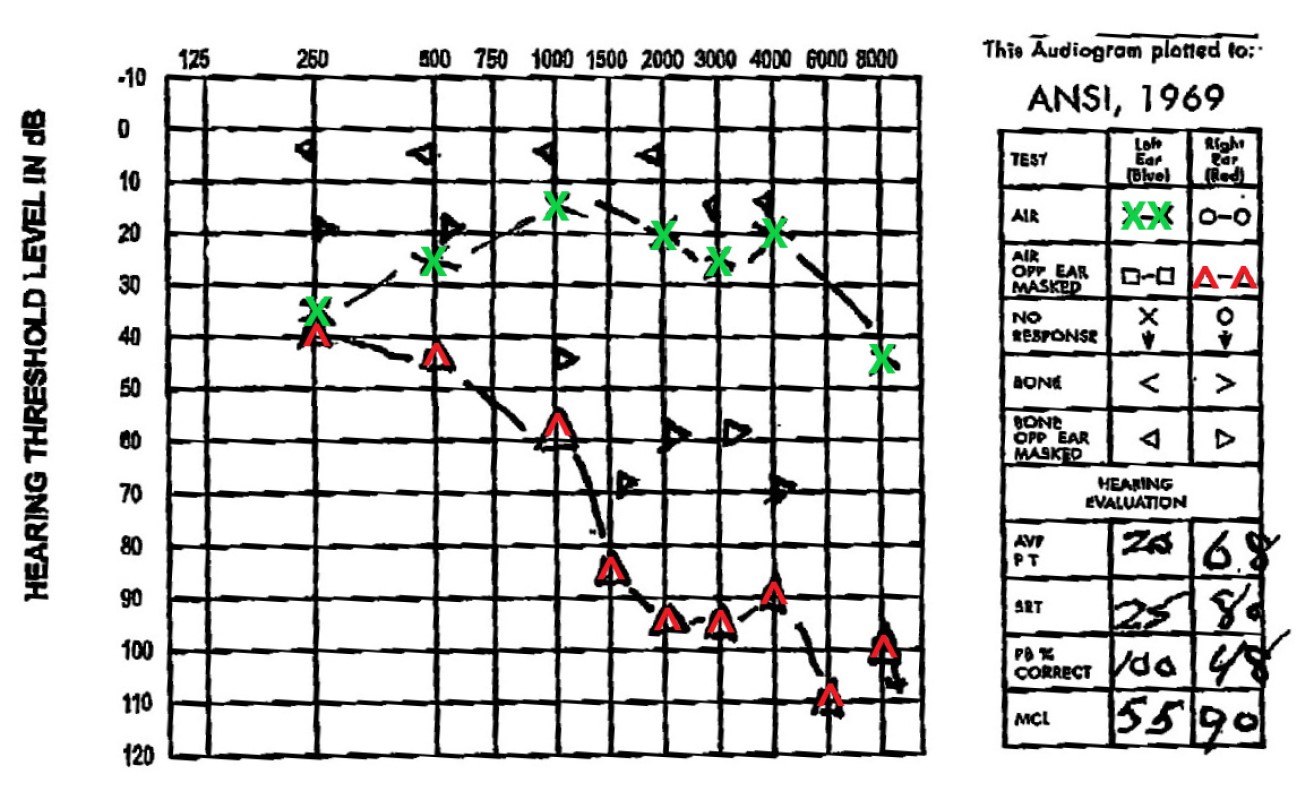
Audiogram performed prior to surgery. It shows the minimum volume of sound (in dB) that can be heard at various frequencies (low to high) in both ears. Left ear (green X) is relatively normal showing a threshold in the range of 10 to 20 dB for typical frequencies. Right ear (red ^) is abnormal showing patient requires 80 to 100 dB of amplification to hear sounds in the 1500 to 6000 Hz range. A typical vacuum cleaner runs at about 70dB and a chainsaw at 100 dB.
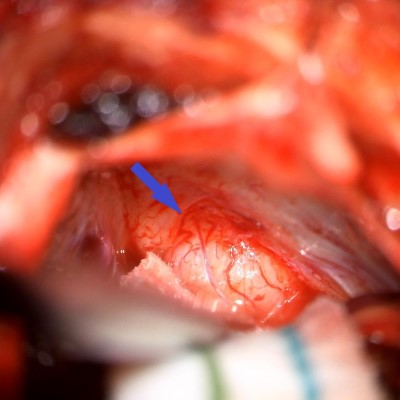
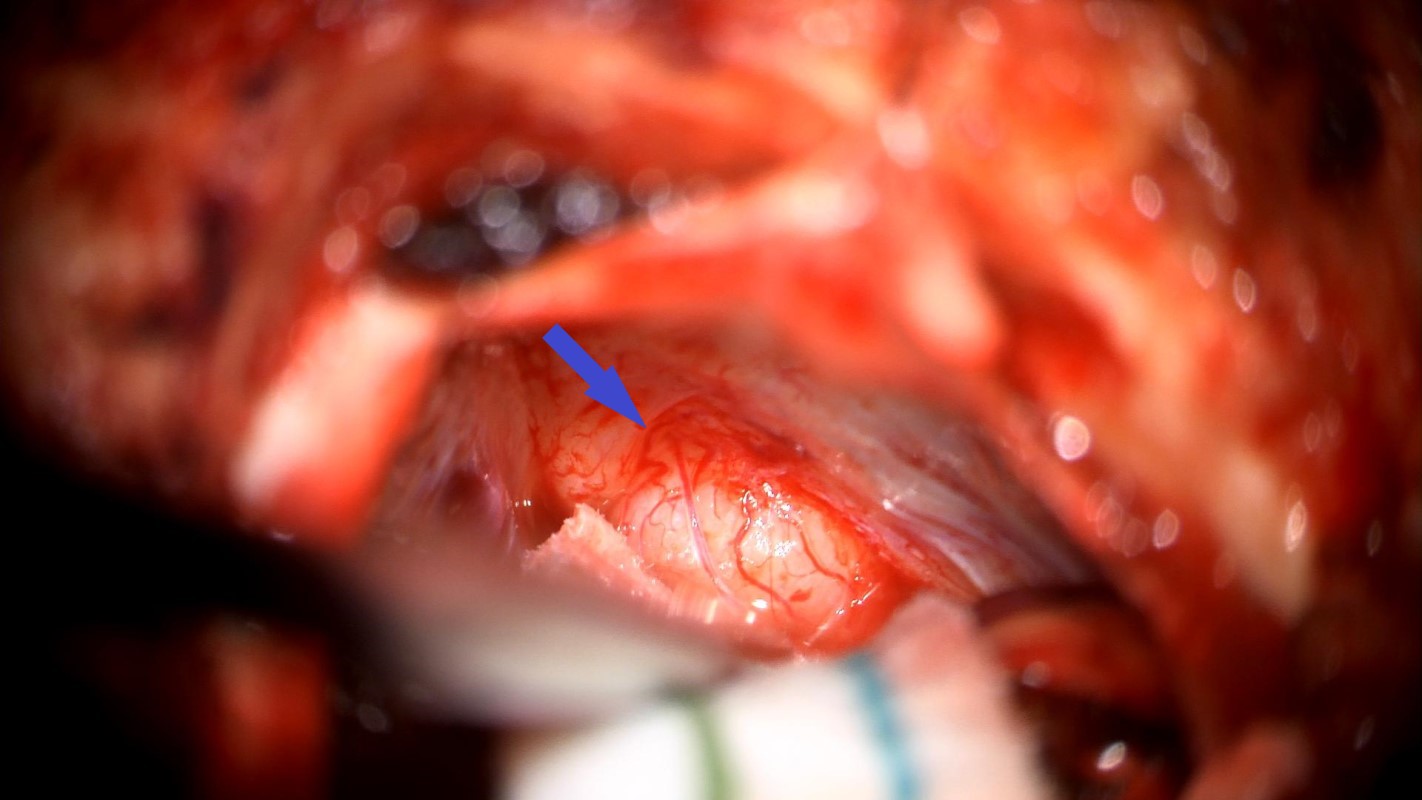
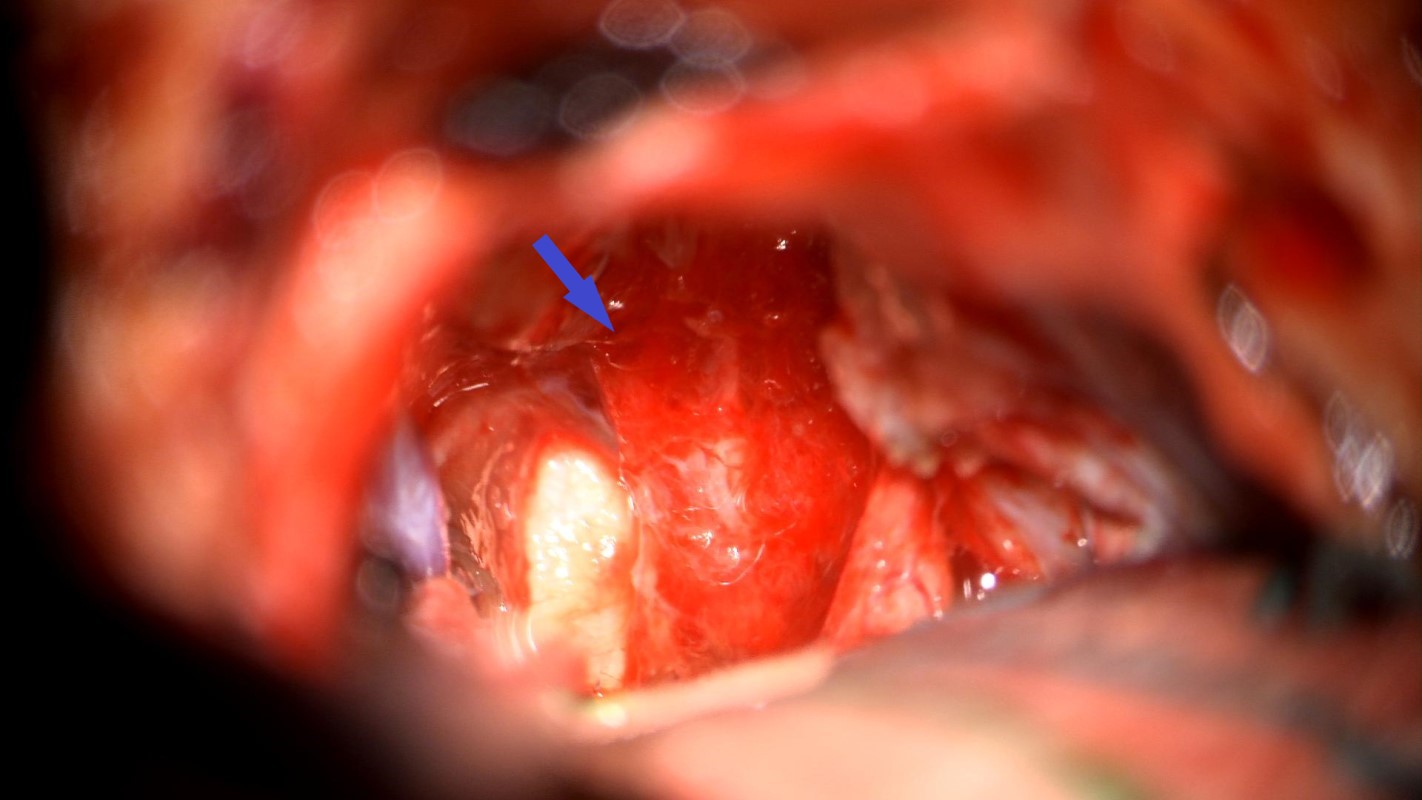
Intraoperative photo acquired from the surgical microscope. It shows the initial views of the tumor. The blue arrow ahs been placed over the bony that lies over the IAC (the porus acusticus) and is pointing at the tumor. Note the instrument approaching the tumor from the left of the frame – it is the image-guided probe seen in Figure 9.
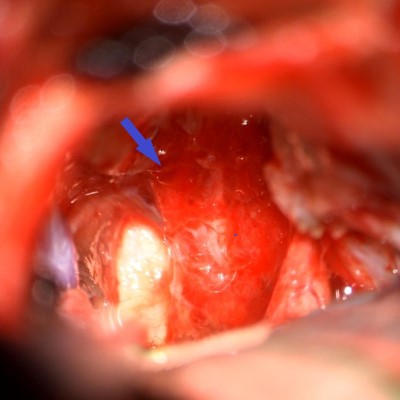
Intraoperative photo acquired with the surgical microscope. The posterior edge of the porus acusticus has been drilled and the tumor has been removed. The blue arrow is pointing at the facial nerve and is in similar position as Figure 8. Note that the trigeminal nerve (white structure to left of facial nerve) can now been seen.
Video captured through surgical microscope. The tumor has been resected and the scope is moving to demonstrate the surgical site and local anatomy of the cranial base.
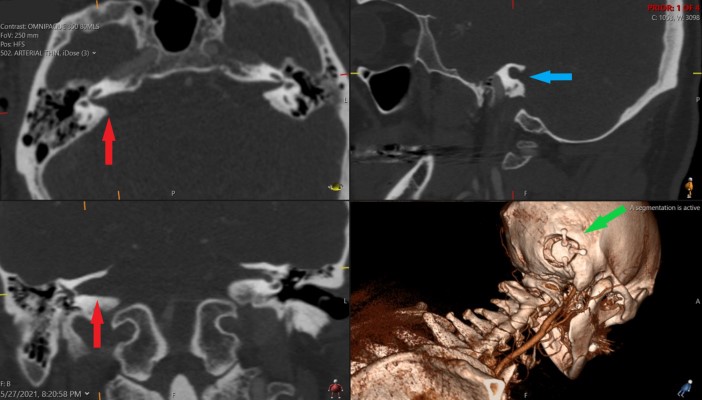
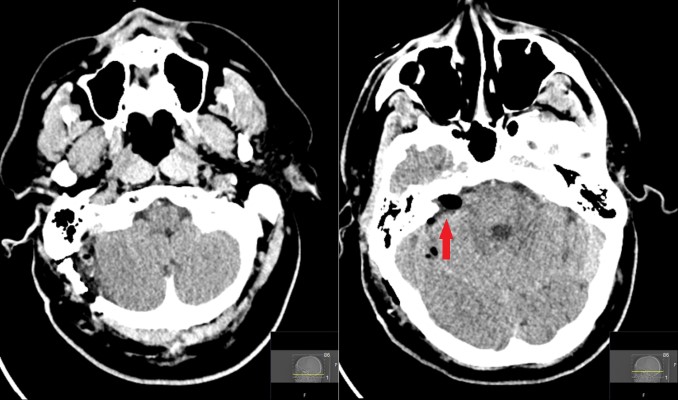
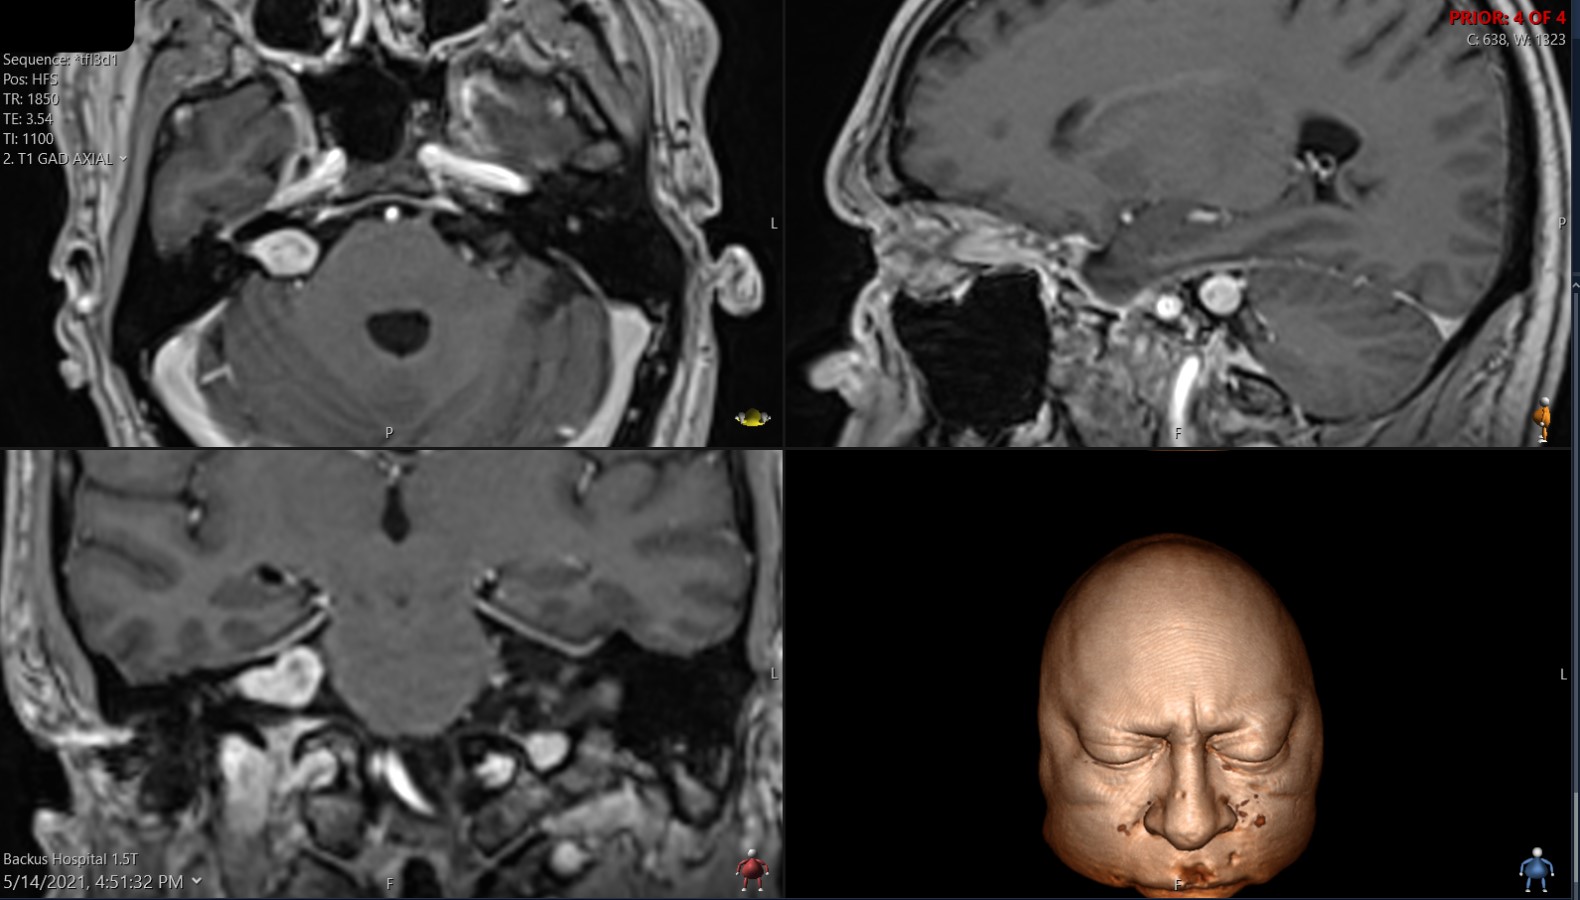
Postop CT obtained about 2 weeks after surgery. It shows widening of the right IAC (red arrows) when compared to the left. It also shows how the IAC was opened during the surgery to remove the tumor (blue arrow) and the 3D rendering (bottom right) shows the craniotomy (with titanium mini-plates) (green arrow)
- All
- Pre-Op
- Intra-op
- Post-op


